
How Police Really Die: Some Numbers
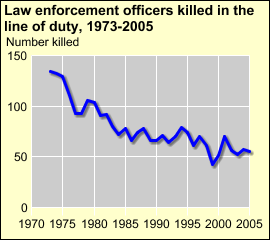
How Police Really Die: Some NumbersThe March 21 killings of four Oakland policemen and April 4 killings of three Pittsburgh policemen have triggered many speeches about the risks faced by the police, with wording similar to the first clause of the homage resolution sponsored by Barbara Lee (D, CA) and passed by Congress (H. Res. 290): Whereas the slaying of Sergeants Dunakin, Romans, and Sakai, and Officer Hege serve as a reminder that the risks assumed by police officers daily in serving and protecting their communities continue to be enormous, ever present, and lethal, even as the number of law enforcement officers killed by gunfire in the United States has steadily declined over the last 20 years... Yet we know that these incidents are not just uncommon, but off the charts: "the deadliest in the history of the Oakland police" the New York Times tells us. And "...by far the deadliest day in the history of the Pittsburgh Police Bureau...it had been more than 13 years since a Pittsburgh Police officer had been killed in the line of duty", according to the blog of the National Law Enforcement Officers Memorial Fund. So if the risks of police work are "enormous" and "lethal", yet incidents like the Oakland and Pittsburgh killings are extraordinary, just how much and what type of lethal risk do police typically face? We can answer these questions by studying both past and current police fatality data, to determine long-term trends and current state. The informal study I did clearly showed that while the risks of police work are higher than the national average, describing them as "enormous" is an overstatement. Moreover, the lethal risks are not the kind that make dramatic front-page news. The study looked at data collected by the US Bureau of Labor Statistics (BLS) for 1992-97 and 2003-06, together with the FBI reports Law Enforcement Officers Killed and Assaulted covering 1992-2007. The study found that during 1992-1997 the lethal risk (measured as fatality rates - the number of fatal work injuries per 100,000 workers) of police work was nearly three times the risk for the average worker. Yet in 1997 police work did not rank in the top ten of highest-risk occupations. It ranked #14 - just above electrician, just below non-construction laborers, and well below farming, roofers, truck and cab drivers, and construction laborers. The highest risk occupations - timber cutter, fisher, seaman, and aircraft pilot - had fatality rates 7-9 times the fatality rate of police. The lethal risk of police work was closer to the risk of the average worker than it was to the high risk work of construction or driving a taxi. The most current BLS fatality data, for 2006, shows risks similar to what was found for 1997: the lethal risk of police work is closer to the risk of the average worker than it is to the high risk work of roofers or farm workers. Risk for taxi drivers and construction laborers have now decreased to be closer to that of police - who are still ranked at #14. Police fatality risk is well below that of refuse workers. But, as the Congressional resolution suggests, the public's perception of lethal risk in police work is not of general lethal risk, but of a particular risk. The perception springs largely from the association of police work with violent confrontations, and thus is focused on the risk of homicide while performing police work. We all know where that association comes from. "As Seen On TV", an article in the Fall 2003 Occupational Outlook Quarterly from BLS, spells it out when Tony Lesce, a freelance writer and author of the book Cops! Media vs. Reality, notes: "When police are on duty, 30 to 50 percent of their time is spent writing reports," he says, but "you almost never see a TV cop sitting at a desk to write a report." Instead, and unrealistically, he says, "every TV cop show you see has a lot of shootouts and car chases...Television shows also exaggerate the violence that police and detectives actually deal with, Lesce says, resulting in far fewer scripted appearances of the more prevalent, but less visually exciting, nonviolent crimes." Still, BLS data from 1992-97 shows that the homicide risk for police was eight times the homicide risk for the average worker. Yet, since 45% of police fatalities resulted from homicides, a police fatality was more likely NOT to be caused by homicide. Almost as many fatalities were caused by transportation incidents. A police fatality from transportation incident or fall was as likely as a homicide. A change in BLS calculation of police data in 2003 led to fatality rates increasing, even as the number of fatalities decreased. Police homicide risk for 2003-06 was over sixteen times the homicide risk for the average worker . Yet the same data shows that transportation incidents are now the leading cause of fatalities in police work. The risk of transportation-related fatality is over 40% greater than the risk of homicide. The number of transportation fatalities has remained steady, while the number of homicides has declined - as mentioned in the Congressional homage resolution cited in the introduction (It is tempting to wonder if the deaths of the Oakland police would have received the same political attention if the deaths had resulted from a traffic accident). The title of a BLS article, using 1998 data, bluntly reveals the stark reality: "Taxicabs have by far the greatest work-related homicide risk" - four times the risk for police in 1998. Taxi driver homicide risk for 2003-06 was twice the police homicide risk. One statistic in particular calls into question the Congressional sermon on "the risks assumed by police officers daily in serving and protecting their communities". In 2007, FBI data placed Oakland as #6 in murder rate among large cities. During 2000-07, 822 homicides were recorded in Oakland (excluding homicides committed by police). Yet while Oakland's general population suffered a risk of homicide that was five to six times the national average during that period, the only Oakland police officer killed in the ten years between Feb 1999 and Feb. 2009 was shot and killed by other Oakland police. The victim, working undercover, was mistaken for a "civilian". Of the top eight most murder-plagued large cities, that's a record for self-protection that no other city's police department matched.
Full Report (includes charts and tables of data): |
Donate

$140.00 donated
in the past month
Get Involved
If you'd like to help with maintaining or developing the website, contact us.
Publish
Publish your stories and upcoming events on Indybay.