

Polar Regions feel the heat of Climate Change

Image: NASA April 6, 2009 - Satellites Show Arctic Literally on Thin Ice
Arctic Warming
According to NASA Arctic Sea Ice extent is still showing a shrinking trend. The thickness of Arctic ice is also reducing. Over the 2009 winter the Arctic had the fifth lowest maximum ice extent on record. The six lowest maximum events since satellite monitoring began in 1979 have all occurred in the past six years (2004-2009).
The composition of the sea ice continues to change. Thin seasonal ice that melts and re-freezes every year now makes up about 70 percent of the Arctic sea ice in wintertime, up from 40 to 50 percent in the 1980s and 1990s. Thicker ice, which survives two or more years, now comprises just 10 percent of wintertime ice cover, down from 30 to 40 percent. The maximum sea ice extent for 2008-09, reached on Feb. 28, was 5.85 million square miles. That is a reduction of 278,000 square miles from the average extent for 1979 to 2000. (See Arctic Sea Ice News for more info)
According to scientists Arctic sea ice works like an air conditioner for the global climate system. The Sea Ice cools air and water masses, playing a key role in ocean circulation, and also reflects solar radiation back into space. Arctic Sea ice also helps refrigerate the Greenland Ice Cap to keep it cold and stable, although research is showing substantial warming changes to the coast of Greenland.
Information on the trends for Sea Ice Cover was provided in a media conference on April 6 by Ronald Kwok, research scientist, NASA's Jet Propulsion Laboratory; Walter Meier, cryosphere scientist, National Snow and Ice Data Center, University of Colorado; and Thomas Wagner, cryosphere program manager, NASA Headquarters, Washington.
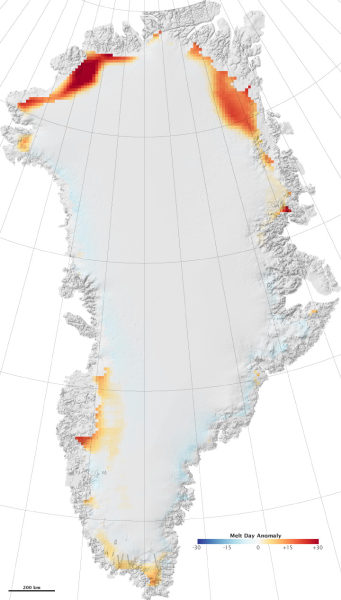
Reasearch in 2008 revealed substantial warming on Greenland's north coast with the ice sheet experiencing extreme melting. The average temperature between June and August 2008 was as much as 3 degrees Celsius above average at ground based weather stations. Ice sheet models from 2006 project that warming would initiate the long-term melting of the ice sheet, leading to a complete melting of the Greenland ice sheet over several millennia, resulting in a global sea level rise of about seven meters.
According to a team of researchers led by University of Wisconsin-Madison geologist Anders Carlson sea level rise from greenhouse-induced warming of the Greenland ice sheet could be double or triple current estimates over the next century. "We're not talking about something catastrophic, but we could see a much bigger response in terms of sea level from the Greenland ice sheet over the next 100 years than what is currently predicted," said Carlson in a report in Science Daily in September 2008.
Antarctic Warming: Wilkins Ice Bridge Collapses
In early April 2009 the Wilkins Ice Bridge connecting Latady and Charcot Island on the Antarctic Peninsula collapsed. The disintegration of this ice bridge will allow the further disintegration of the Wilkins ice shelf. A large part of the Wilkins Ice Shelf disintegrated in February 2008.
As this ice is already floating on water, the subsequent melting will not affect sea levels. Neither does the Wilkins Ice Shelf buttress any major glaciers that would increase speed and thus contribute to increased sea levels. However the breakup is symptomatic of increasing warming being felt in the Southern Ocean and particularly the Antarctica Peninsula and West Antarctica.
Ted Scambos of the National Snow and Ice Data Center said that many factors contributed to the collapse of the ice shelf, including brine on the ice, physical stresses on the shelf, and warming temperatures.
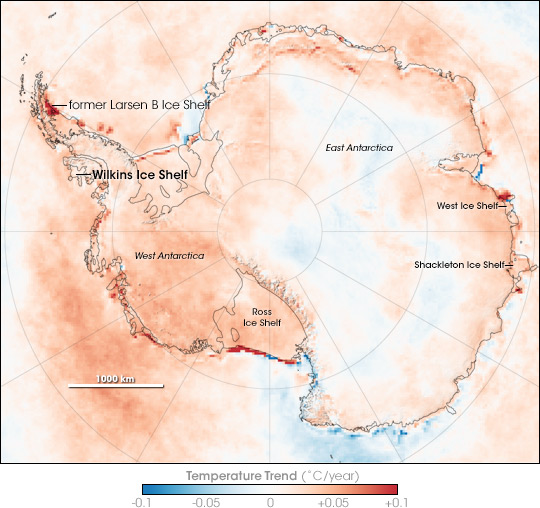
Over the previous 50 years, the Antarctic Peninsula has experienced a temperature increase of 0.5 degrees Celsius (0.9 degrees Fahrenheit) per decade, making it one of the fastest warming places on Earth, according to the National Snow and Ice Data Center.
"Everyone knows it has been warming on the Antarctic Peninsula, where there are lots of weather stations collecting data," said Eric Steig, a climate researcher at the University of Washington in Seattle, "Our analysis told us that it is also warming in West Antarctica." Eric Steig used satellite data and statistical analysis to confirm the warming trend as data collection on the ground is restricted to primarily the few ground-based weather stations around the coast of Antarctica.
West Antarctica is particularly vulnerable to climate changes because its ice sheet is grounded below sea level and surrounded by floating ice shelves holding back several glaciers. If the West Antarctic ice sheet completely melted, scientists estimate global sea level would rise by 16 to 20 feet (5 to 6 meters).
The Wilkins Ice Shelf is the tenth major ice shelf to collapse in recent times. The Larsen B ice shelf rapidly and spectacularly collapsed in 2002, allowing the pent up glacier ice to more rapidly discharge.
Background
- San Fransisco Bay Area IMC - Mar 11, 2009 - Scientists confirm Rising Sea Levels may exceed one metre this century
- San Fransisco Bay Area IMC - Mar 16, 2008 - Meltdown: Global warming by the numbers
- San Fransisco Bay Area IMC - Oct 11, 2007 - Arctic Sea Ice heading for Rapid Disintegration: Greenland Ice Sheet melting
- Climate IMC - March 17, 2007 - NASA Climatologist Predicts Disastrous Sea Level Rise
- Climate IMC - Jan 4, 2006 - Greenland Ice Sheet melting faster than expected
- Climate IMC - Feb 5, 2006 - Dramatic Change in West Antarctic Ice Could Produce 16ft Rise in Sea Levels
- Climate IMC - Feb 20, 2006 - NASA's Jim Hansen on Greenland ice pack
Sources:
- NASA April 6, 2009 - Satellites Show Arctic Literally on Thin Ice
- NASA Feb 25, 2009 - Melting on the Greenland Ice Cap, 2008
- Science Daily Sep 1, 2008 - Faster Rise In Sea Level Predicted From Melting Greenland Ice Sheet, Based On Lessons From Ice Age
- NASA March 28, 2008 - Disintegration: Antarctic Warming Claims Another Ice Shelf
- NASA December 4, 2008 - New Cracks in the Wilkins Ice Shelf
- NASA April 8, 2009 - Wilkins Ice Bridge Collapse
- NASA January 21, 2009 - Satellites Confirm Half-Century of West Antarctic Warming
- NASA January 23, 2009 - Antarctic Warming Trends
- RealClimate Blog - April 6, 2009 - Wilkins ice shelf collapse


Donate

$140.00 donated
in the past month
Get Involved
If you'd like to help with maintaining or developing the website, contact us.
Publish
Publish your stories and upcoming events on Indybay.